Plots for survival models
survPlots.RdPlots for survival models
Arguments
- model
CoxPH model object
- time
Time point to show performance at
- df
Data contained in data frame
- eventVar
Name of the event variable in df
- timeVar
Name of the time variable in df
- plotType
One of "ROC", "Calibration", or "Decision"
- xlim
Limit of the x-axis for "Calibration" or "Decision"
- ylim
Limit of the y-axis for "Calibration"
- colour
Colour of the plot line
- harm
Harm of the model for the decision curve
Value
GGPlot object
Examples
# Example using Rotterdam breast cancer data
library(survival)
mod <- coxph(Surv(rtime, recur) ~ age+meno+grade+size, data = rotterdam)
head(rotterdam)
#> pid year age meno size grade nodes pgr er hormon chemo rtime recur dtime
#> 1393 1 1992 74 1 <=20 3 0 35 291 0 0 1799 0 1799
#> 1416 2 1984 79 1 20-50 3 0 36 611 0 0 2828 0 2828
#> 2962 3 1983 44 0 <=20 2 0 138 0 0 0 6012 0 6012
#> 1455 4 1985 70 1 20-50 3 0 0 12 0 0 2624 0 2624
#> 977 5 1983 75 1 <=20 3 0 260 409 0 0 4915 0 4915
#> 617 6 1983 52 0 <=20 3 0 139 303 0 0 5888 0 5888
#> death
#> 1393 0
#> 1416 0
#> 2962 0
#> 1455 0
#> 977 0
#> 617 0
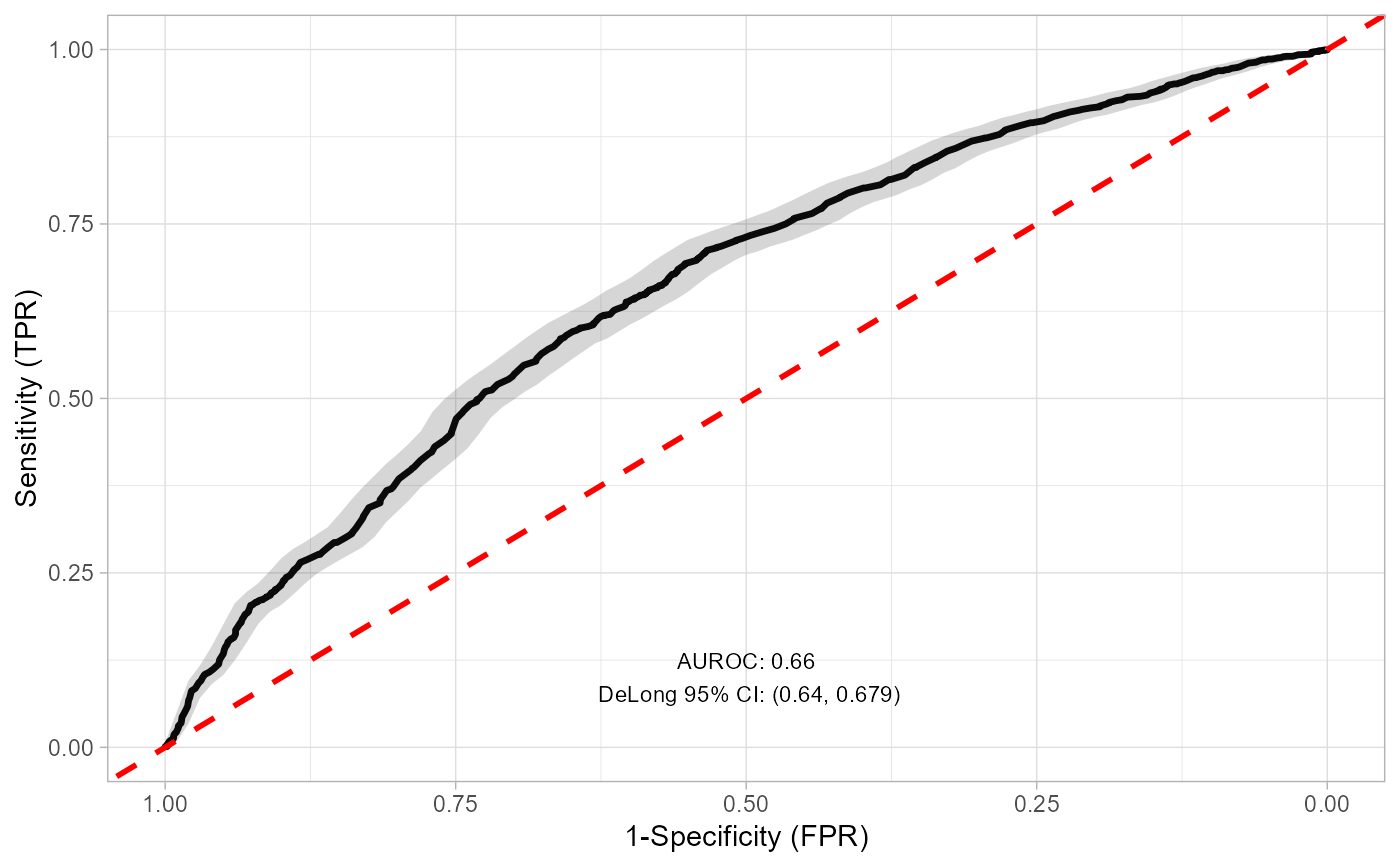
survPlots(
model = mod,
time = 2000,
df = rotterdam,
eventVar = "recur",
timeVar = "rtime",
plotType="ROC")
#> Setting levels: control = 0, case = 1
#> Setting direction: controls < cases
#> Scale for x is already present.
#> Adding another scale for x, which will replace the existing scale.
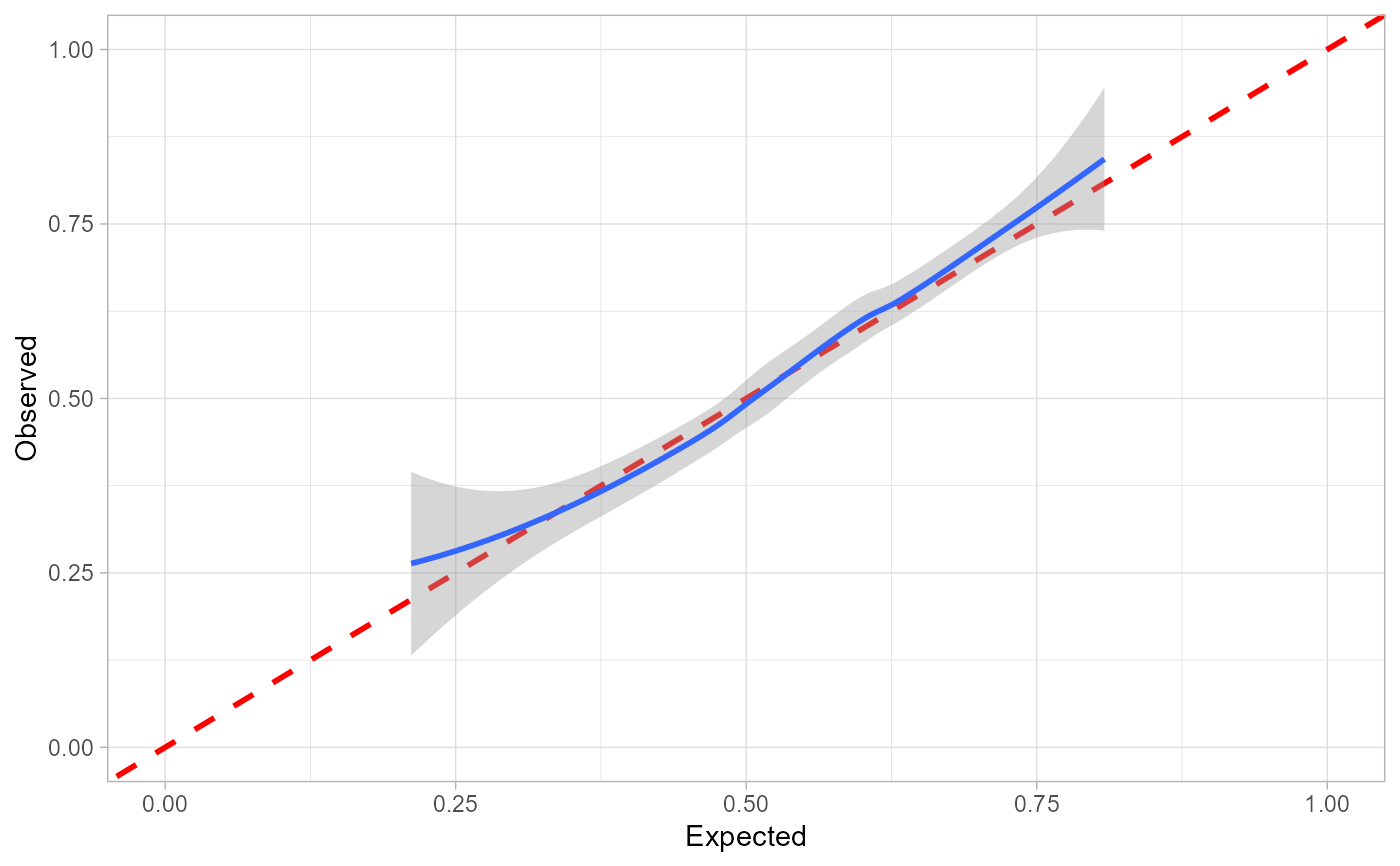
 survPlots(
model = mod,
time = 2000,
df = rotterdam,
eventVar = "recur",
timeVar = "rtime",
plotType="Calibration")
#> `geom_smooth()` using formula = 'y ~ x'
survPlots(
model = mod,
time = 2000,
df = rotterdam,
eventVar = "recur",
timeVar = "rtime",
plotType="Calibration")
#> `geom_smooth()` using formula = 'y ~ x'
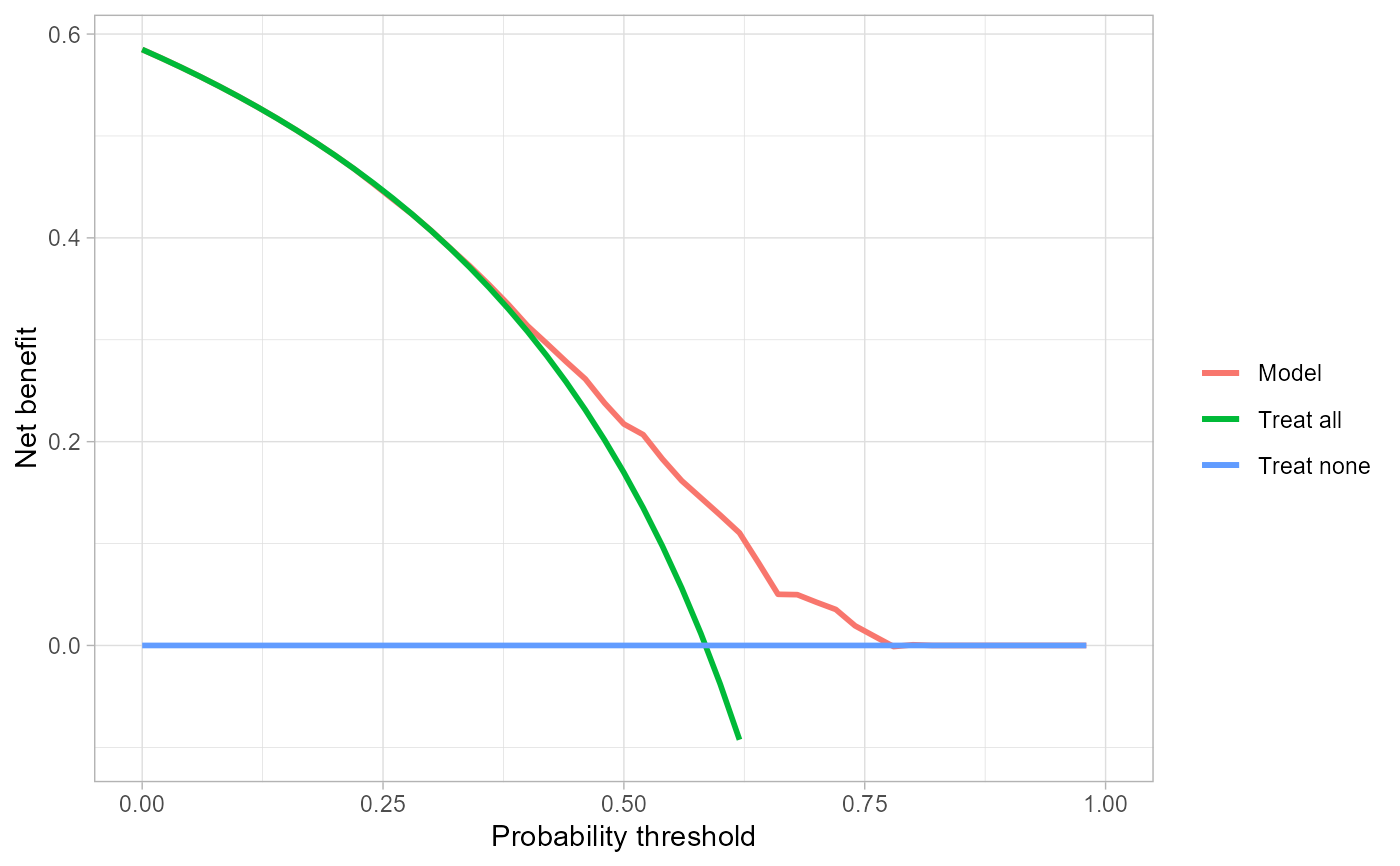
 survPlots(
model = mod,
time = 2000,
df = rotterdam,
eventVar = "recur",
timeVar = "rtime",
plotType="Decision")
#> Warning: Removed 1 row containing missing values (`geom_line()`).
#> Warning: Removed 1 row containing missing values (`geom_line()`).
survPlots(
model = mod,
time = 2000,
df = rotterdam,
eventVar = "recur",
timeVar = "rtime",
plotType="Decision")
#> Warning: Removed 1 row containing missing values (`geom_line()`).
#> Warning: Removed 1 row containing missing values (`geom_line()`).
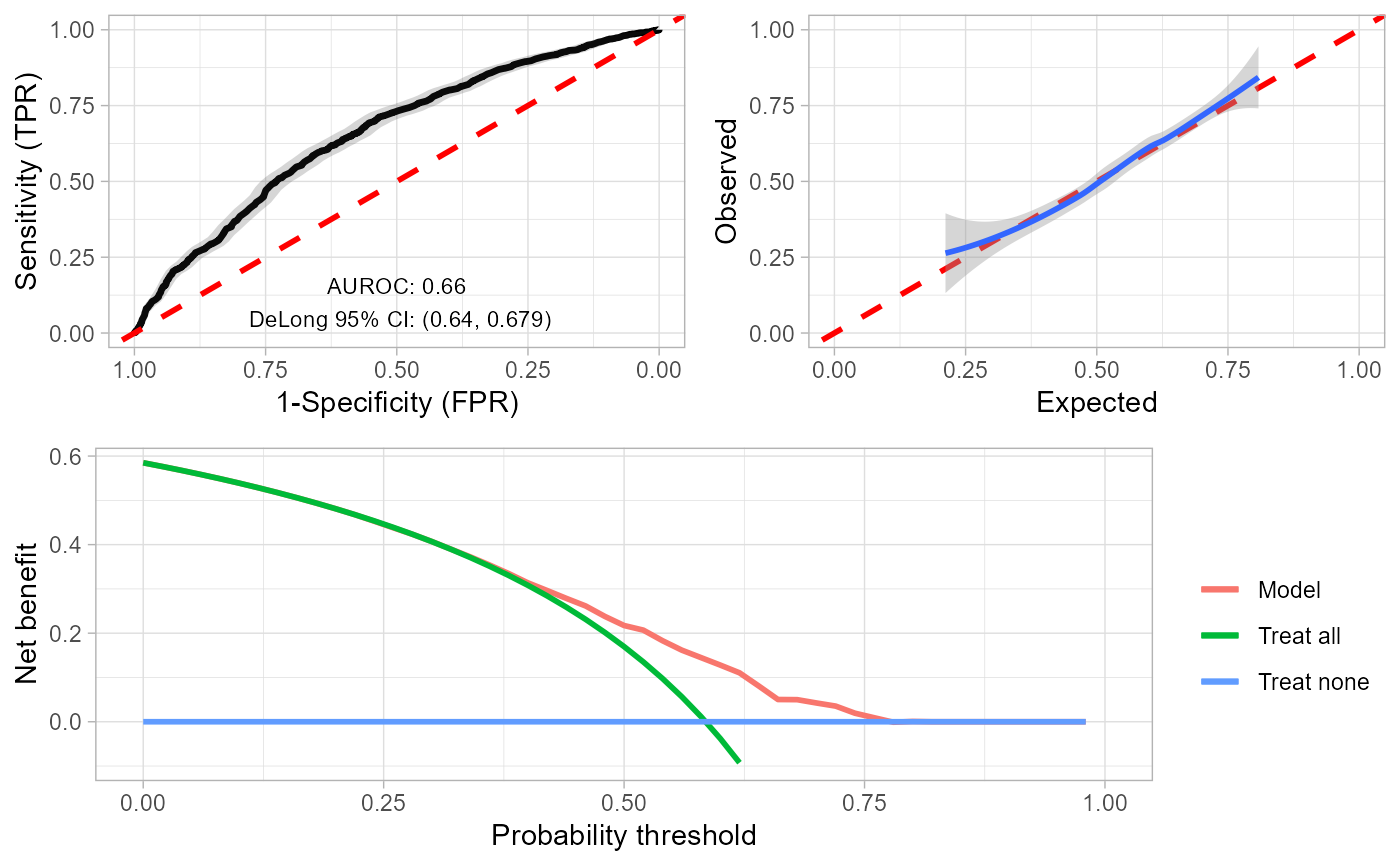
 survPlots(
model = mod,
time = 2000,
df = rotterdam,
eventVar = "recur",
timeVar = "rtime",
plotType="All")
#> Setting levels: control = 0, case = 1
#> Setting direction: controls < cases
#> Scale for x is already present.
#> Adding another scale for x, which will replace the existing scale.
#> `geom_smooth()` using formula = 'y ~ x'
#> Warning: Removed 1 row containing missing values (`geom_line()`).
#> Warning: Removed 1 row containing missing values (`geom_line()`).
survPlots(
model = mod,
time = 2000,
df = rotterdam,
eventVar = "recur",
timeVar = "rtime",
plotType="All")
#> Setting levels: control = 0, case = 1
#> Setting direction: controls < cases
#> Scale for x is already present.
#> Adding another scale for x, which will replace the existing scale.
#> `geom_smooth()` using formula = 'y ~ x'
#> Warning: Removed 1 row containing missing values (`geom_line()`).
#> Warning: Removed 1 row containing missing values (`geom_line()`).